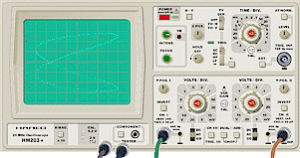
If the “X-Y” button is on, the horizontal deflection (X) of the electronic beam drawing the curve is not controlled by the sawtooth generator of the oscilloscope but by the signal attached to channel 2. The vertical deflection (Y) is determined by the signal attached to channel 1. Both input signals can be added if needed (“Add” Schalter), so that the sum of both channels can deliver the vertical signal.
From the combination of different signals the figures named after their discoverer “Lissajous” appear on the screen. They enable a user to determine the phase and the frequency ratio between both input signals. The following images show examples:

The horizontal signal frequency is twice as high as the vertical frequency. You can notice that the lines are touching the left and right edge at two locations. The phase is 270°. At 0° and 180° the crossing point is located on the center of the screen, for values larger 180° it is located left from the center, for values smaller 180° it is locaed right from the center.

The signal frequencies are identical. You can tell that from the fact that the curve touches the right and left edge at one location only. As a circle (or at least an oval perpendicular to one of the axis) is created, the phase must be 90° (or 270°), because the axis perpendicular to one another for the horizontal and vertical signal deliver data according to a sinus and matching cosinus.
